
By Marcus Wild

Marcus Wild
Within the maritime industry, ships use SONAR (Sound Navigation and Ranging) systems in order to make maps of the seabed. The problem with SONARs, is that they can have a tendency to overheat. Indeed, SONARs are composed of materials which exhibit energy loss, i.e., a percentage of the energy input into these materials is converted to heat. High temperatures can cause the SONARs to perform inefficiently and over time will damage the materials. Our aim is to predict the temperature rise in the materials used in SONARs. This will help us to design more efficient SONARs which in turn will allow us to push the performance of these systems.
High temperatures can cause the SONARs to perform inefficiently and over time will damage the materials.
SONARs emit sound waves, which then bounce off the seabed and return to the ship, in the same way that a bat or a dolphin uses sound to find its prey. SONARs are made of many components, but one of the most important components is the piezoelectric (piezo means squeeze) material. When pressure is applied to this type of material, an electric current is produced and reversely, when an electric current is applied to this material, it generates a sound wave (like a microphone and an amplifier). This behaviour is very useful and this material is the driving mechanism behind the sound wave generated by SONAR. However, some of this energy is also converted into heat, and too much heat will damage the SONAR.
In order to predict the heating in the piezoelectric material, the material properties such as the stiffness, electric characteristics (specifically, electric permittivity) and the electromechanical coupling factor (how easily the material converts mechanical energy like sound to electrical energy and vice versa) need to be characterised accurately.
Once these material characteristics have been determined, the power dissipation as a function of space and frequency can be calculated. The calculated power dissipation density, which can be thought as the amount of input energy converted to heat, for one particular frequency is shown in Fig. 1.
-
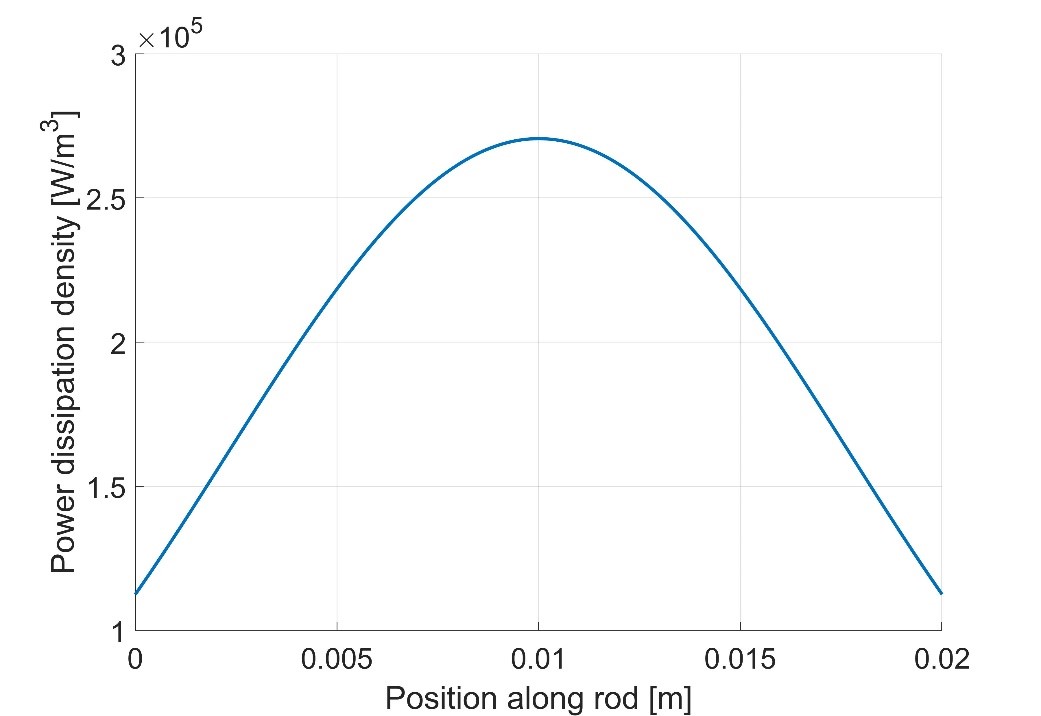
Figure 1: Power dissipation density as a function of position along the length of the rod.
Therefore, based on the calculated material parameters and the theory surrounding piezoelectric materials, the power dissipation at the centre of the rod should be more significant than at the edges of the rod. Using the curve in Fig. 1, we can now attempt to predict the temperature rise in a piezoelectric rod. An experimental setup was designed, shown in Fig. 2, in order to achieve this. The piezoelectric rod is placed in an insulating box in order to have a more stable convection rate (cooling due to air flow). A voltage is applied to the piezoelectric rod at a particular frequency through the copper wire in order to cause self-heating. Three thermocouples are attached at different positions along the side of the rod to measure the distribution of the temperature as the piezoelectric heats up. This setup is duplicated in a Finite-Element-Method software called COMSOL in order to model the temperature rise at the thermocouple positions.
-
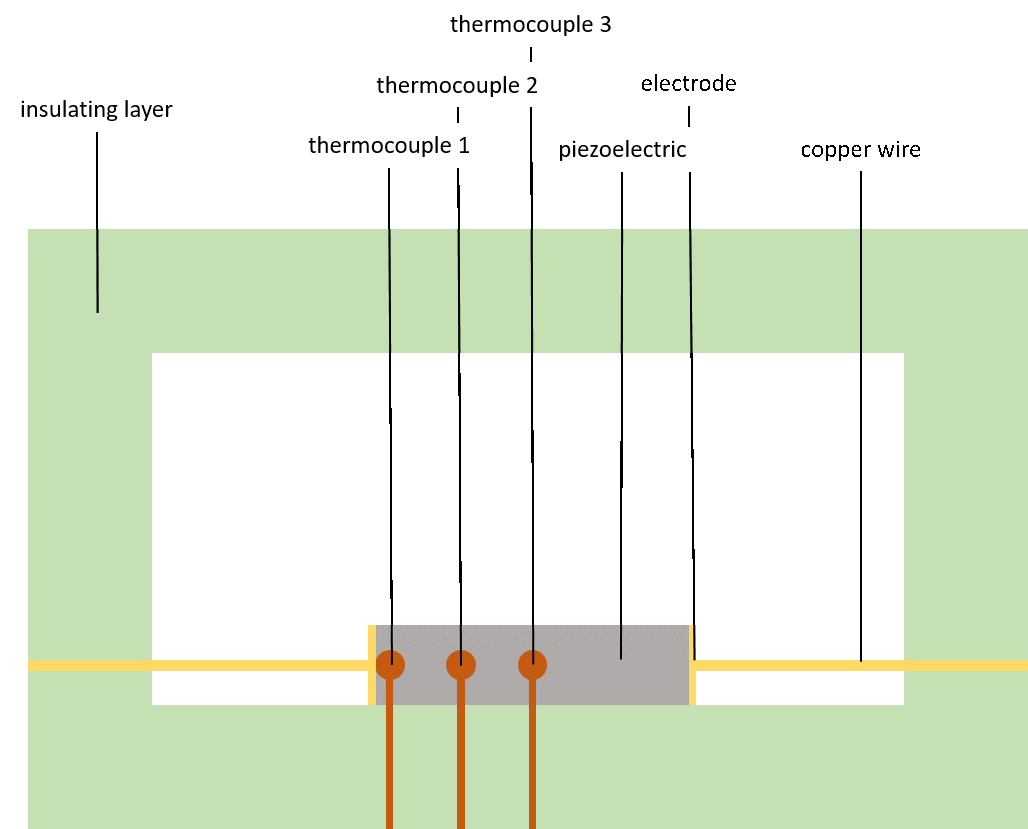
Figure 2: Illustration of experimental setup (side view) to measure temperature along the length of the piezoelectric rod.
-
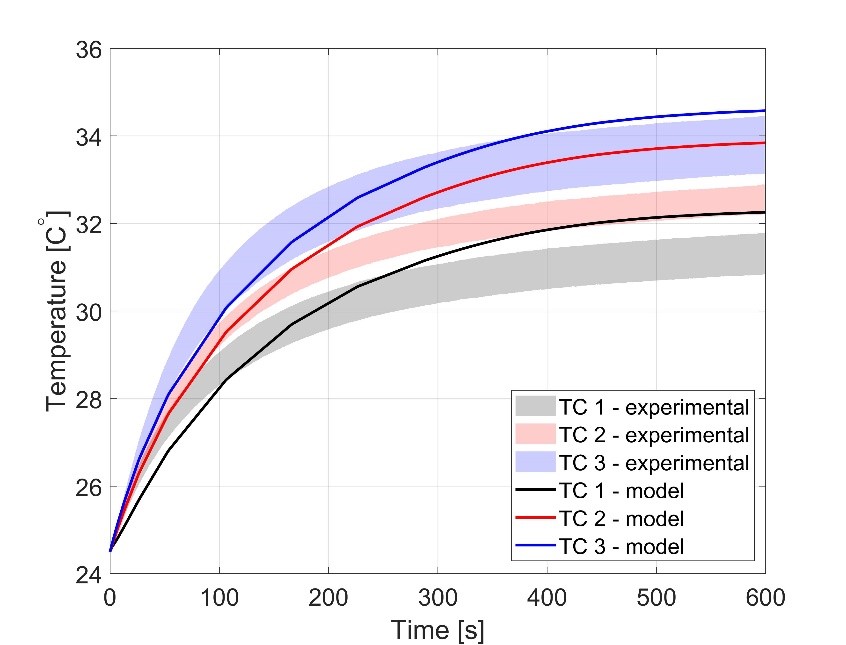
Figure 3: Temperature rise at the thermocouple positions as a function of time. TC stands for thermocouple. The experimental curves show a range of temperatures for each time sample due to experimental uncertainty.
Fig. 3 shows the comparison between the modelled and measured temperature rise at the thermocouple positions. Although there are discrepancies between the measured and modelled temperature curves, the overall trend between the thermocouples does seem to have been captured well. This would suggest that the power dissipation density curve does indeed resemble the predicted curve shown in Fig. 1. Although this work does require a more accurate experimental setup and thermal material parameters in order to add confidence to this conclusion, we are confident that this a good first step to predicting the temperature in piezoelectric materials.