By Morten Smedsrud Wigen, PhD Candidate, Department of Circulation and Medical Imaging and CIUS – Centre for Innovative Ultrasound Solutions
To understand and measure the dynamics of the blood flowing in the heart, has been a subject of interest for centuries. Today we know that abnormal blood flow can be markers for developed or developing heart disease.
Given that cardiovascular related diseases are the most probable cause of death globally, according to WHO, we believe that more information regarding blood behaviour can help the doctors make better diagnosis at an earlier stage. But how can you measure these properties inside the heart, behind the ribs, under the skin, without moving the patients from their bed?
At CIUS (Center for Innovative Ultrasound Solutions) resources are put into finding and developing new ultrasound methods achieving this from different angles. Estimating velocities with ultrasound is usually based on the Doppler effect.
A well-known phenomenon caused by the Doppler effect is the change of the observed frequency – the sound pitch – when an ambulance is passing you with sirens. Due to the velocity of the ambulance we get a frequency change of the sound waves, but we also get an additional frequency change depending on where we are in relation to the ambulance.
The first effect can be used to calculate the speed of the ambulance; however, the latter makes this more challenging. In more technical terms; using Doppler we only measure one of the three velocity components of a moving object, that is the component in the direction of the sound waves.
Photos: The first picture shows a rig used for validating our method. An artificial ventricle (second picture) – imaged alone on the ultrasound scanner – was made with a circulation system to simulate blood flowing in a heart chamber.
In my Ph.D. project, we want to overcome the current limitations of the Doppler measurements and estimate the true three-dimensional velocity components in a three-dimensional volume, i.e. the adult heart’s left ventricle. As blood motion is a 3D phenomenon, our hypothesis is that such a method can gain additional information compared to current available methods and ease that task of understanding flow behaviour and to distinguish normal from abnormal blood flow.
When looking at an ultrasound image of the heart, blood appears invisible (dark) compared to the surrounding heart walls (bright). An analogy to this can be a fly-fisher trying to see salmon in a river in bright daylight. The water surface reflects so much of the light that what is beneath the surface is obscured. The fisher would put on sunglasses with a polaroid filter to look beneath the water surface. Our equivalent to polaroid glasses are called clutter-filters, which exploits that signal from blood have different frequency components than it’s surroundings, making it possible to filter out the strong signal from the stationary objects(tissue).
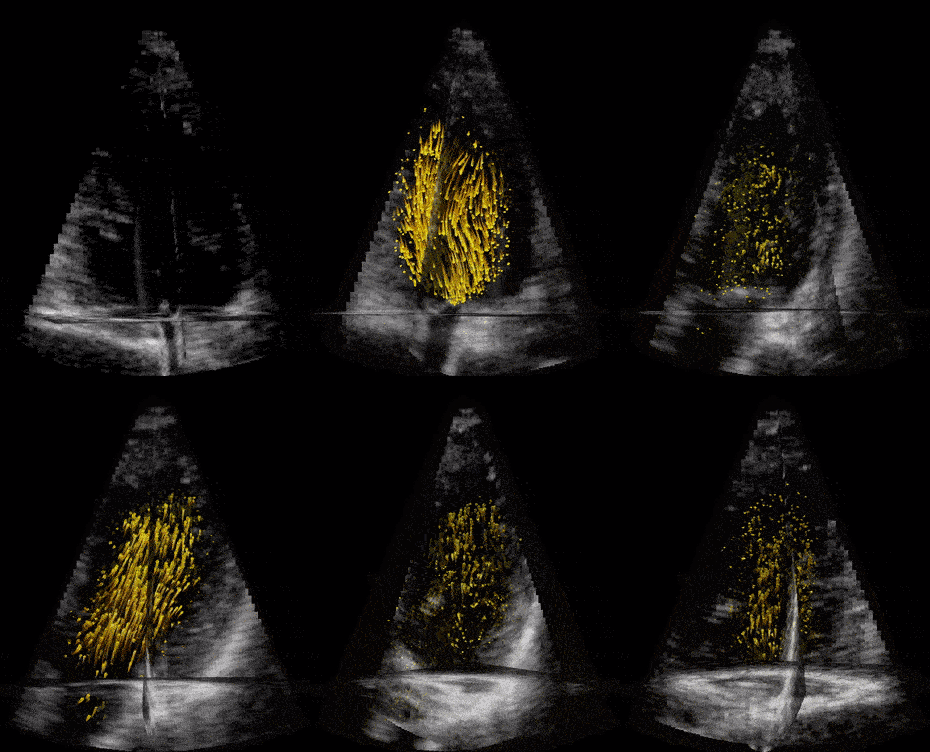
When our ultrasound signal is filtered, we are left with signal coming from the blood alone, and we can perform blood velocity estimation. The raw ultrasound data are acquired at the scanner at the rate of ~20 GB/s(!) and can produce thousands of volume frames per second. With such a high frame rate the blood will just slightly move between each frame. This small motion is tracked by our developed tracking algorithm which estimates one corresponding velocity estimate in every 3D pixel (voxel) of an acquired volume. We acquire these frames through the cardiac cycle, process the data, and then do measurements and visualize the velocity field of the blood. We typically acquire one set of images to see anatomy (black and white background), called bmode, and one for the blood flow estimation, visualized as orange particles in the last figure.
First image: Example of ultrasound images of a child’s heart before clutter filtering.
Second image: Same data at same rate as to the left, however, with applied clutter filter. Now the blood can be seen moving in the heart’s ventricles. This child’s heart has a congenital heart disease with a shunt between the two ventricles.
The above describes the principles in the technology used in my research, the real world is, however, more problematic and challenging. A fundamental challenge when imaging the heart is to transmit and receive sound waves through the chest. As the high frequency sound waves we use don’t penetrate the chest ribs, we must use an ultrasound probe with a very small aperture which limits the resolution – same as with cameras where larger apertures and full frame sensors have sharper images than a phone camera.
Clutter-filtering is not as ideal as described, as the heart is also moving, making it sometimes difficult to distinguish the signal from blood and tissue. The processing we do is also very computationally demanding, and takes around 1 hour for each dataset. In other words, the method is not currently running in real-time, which is one of ultrasounds strength, but with the help of time, technology will catch on making also this possible.
All-in-all we have promising and uplifting results and we can say that we are the first in the world to demonstrate 3D blood flow in the hearts whole left ventricle, but we also face challenges and will need feasibility studies to find out how this can be used on patients.

3D visualization of blood flowing through a cardiac cycle in a healthy volunteer. The black and white slices, are called bmode and shows anatomy, while the blood’s movement is visualized as synthetic particles in orange.
