By Eliva A. Ambugo, Senter for omsorgsforskning (Centre for Care Research), NTNU in Gjøvik
Characteristics of doctors working in nursing homes and similar institutions in Norway in 2011, 2014 and 2017.
This article describes some findings from the report Kartlegging av medisinskfaglig tilbud i sykehjem og heldøgns omsorgsboliger (Survey of professional medical services in nursing homes and residential care homes). Specifically, it presents descriptive characteristics of doctors employed in nursing homes or similar institutions in Norway in 2011, 2014 and 2017. Data are from KS’ (The Norwegian Association of Local and Regional Authorities) PAI register.
A total of 151 different municipalities were represented in the analyses: 103 municipalities in 2011, 108 in 2014 and 124 in 2017; and there were a total of 799 doctors working in nursing homes across these years. Specifically, there were 321, 383 and 448 doctors working in nursing homes in 2011, 2014 and 2017 respectively.
Turnover: As shown in Table 1, over two-thirds of the doctors worked in nursing homes in only one of the three years (2011, 2014 and 2017); and only approx. 10% of doctors worked in nursing homes at all three periods. These figures suggest high turnover. Even so, there was some improvement whereby, while approx. 7% of all doctors were only employed in 2011 and 2014, the proportion only employed in 2014 and 2017 rose to 15.1%.
Table 1: Continuity: Proportion of doctors employed in nursing homes in the period 2011-2017
| Doctor-continuity at different points | Percent | #. Doctors |
|---|---|---|
| Proportion of doctors who were employed at only one point in time (2011, 2014 or 2017) | 65.3 % | 522 |
| Proportion of doctors who were only employed in 2011 and 2014 | 6.9 % | 55 |
| Proportion of doctors who were only employed in 2014 and 2017 | 15.1 % | 121 |
| Proportion of doctors who were only employed in 2011 and 2017 | 3.1 % | 25 |
| Proportion of doctors who were employed at all three points in time (2011, 2014 and 2017) | 9.5 % | 76 |
Age: The doctors were between 25 and 80 years old during the study period, with an average age of 47 years in 2011, which then declined to 45 years in 2017.
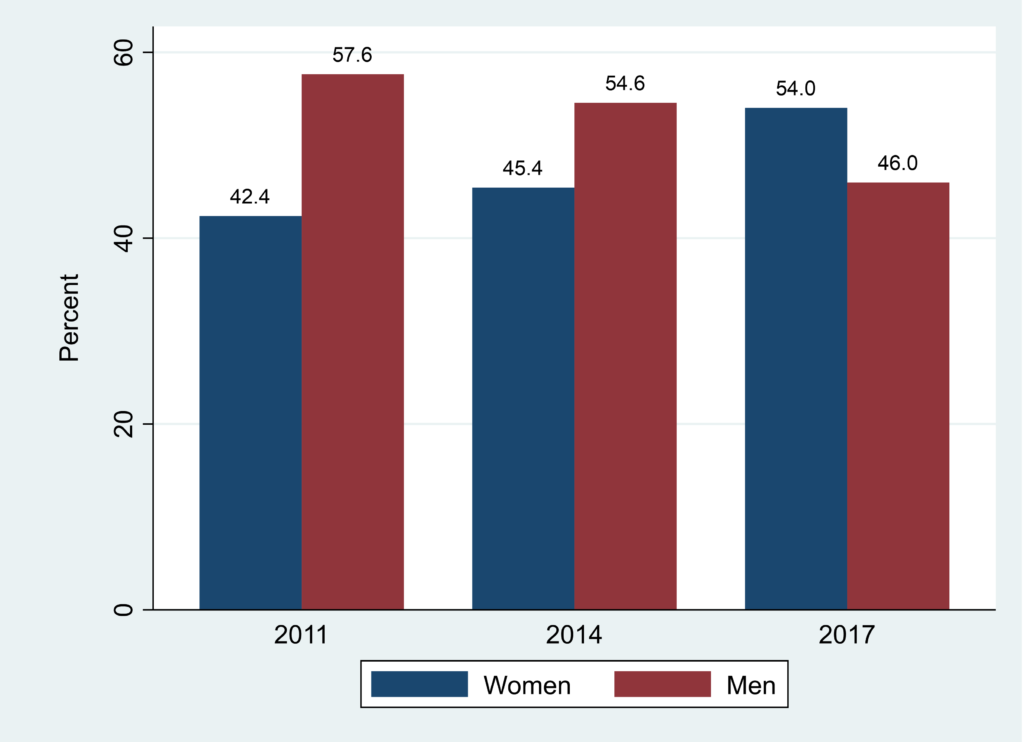
Gender: The distribution of male and female doctors was fairly similar across the years. There was, however, a clear tendency towards more female doctors in nursing homes (from 42% in 2011 to 54% in 2017).
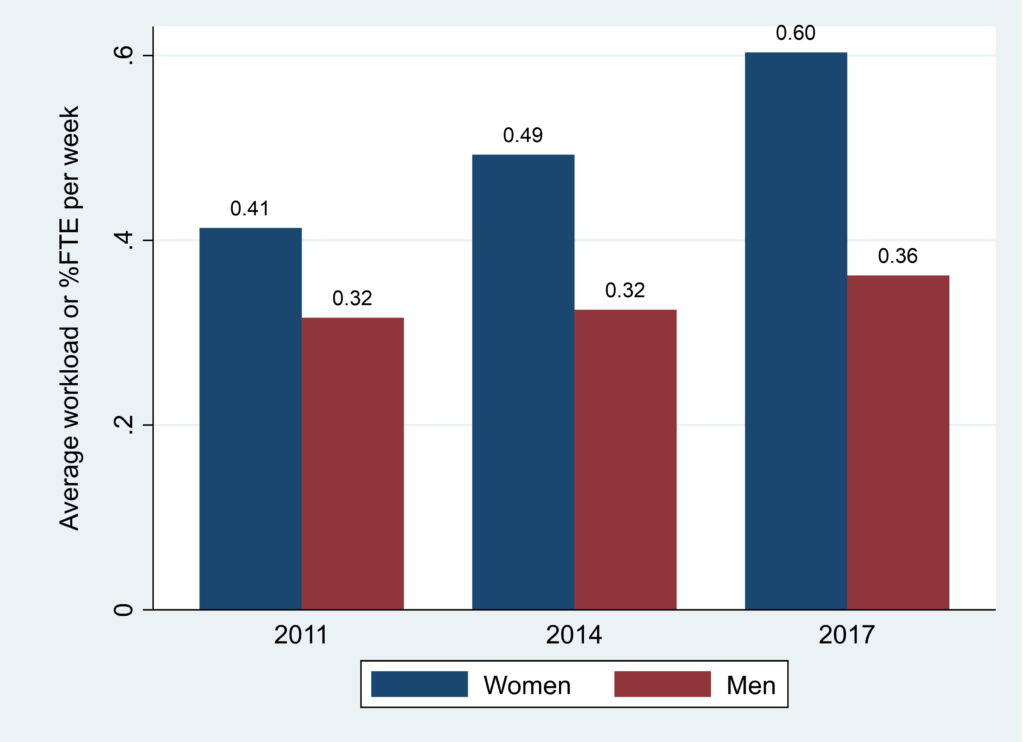
Part-time positions: Only 11% of doctors had a full-time position in 2011, and although this figure rose to 14% in 2014 and 24% in 2017, part-time employment is still the norm. Figure 2 also shows that women worked more hours (full time equivalents/FTEs) in nursing homes in 2011, 2014 and 2017 compared to men.
Table 2: Workload (% full-time equivalent) among the doctors.
| Year | #.doctors | Average | SD | Median | Min | Max | 1.quartile | 2.quartile | 3.quartile | 4.quartile |
|---|---|---|---|---|---|---|---|---|---|---|
| 2011 | 321 | 36 | 29 | 20 | 3 | 100 | 11 | 19 | 37 | 86 |
| 2014 | 383 | 40 | 31 | 24 | 3 | 100 | 16 | 23 | 39 | 88 |
| 2017 | 448 | 49 | 34 | 40 | 2 | 110 | 16 | 33 | 64 | 100 |

Figure 2: Workload (% full-time equivalent/FTE) and gender among the doctors. Source: PAI register data. Workload (% full-time equivalent/FTE) is «the percent FTE on which the employee’s base salary is calculated” (1.00 = 100% = 37.5 hours per week).
The statistics here should be viewed with caution. Even though there are routines for assuring the quality of PAI register data, errors and omissions in the data can occur due to differences between municipalities in data reporting, and in how the variables in the register are defined and understood. Any such errors can lead to inaccuracies in the statistics reported here, which should therefore be approached with caution.
Reference:
Research report: Kartlegging av medisinskfaglig tilbud i sykehjem og heldøgns omsorgsboliger.
Authors: Melby, Line; Ågotnes, Gudmund; Ambugo, Eliva Atieno; Førland, Oddvar.


